From six founding members in 1830 to nearly 17.9 million today: members, temples, stakes, congregations and missionaries, year by year.
gatheredin.one · Updated November 2026 · Figures as of December 31, 2025 unless noted
Note: These charts are an interim version. They will be rebuilt as live, dynamic charts driven by an updated LDS membership statistics dataset, with more history and more detail.
The Church of Jesus Christ of Latter-day Saints was organized on April 6, 1830, in upstate New York with six members. It took 117 years, until 1947, to pass one million. Today the Church reports more members, temples and stakes than ever before. How fast it is growing, though, has changed a lot over time. The charts below follow that story using the Church’s own annual statistical reports and long-running historical tables.
17,887,212
Total members (end of 2025)
211
Operating temples (204 in operation plus 7 in renovation)
3,695
Stakes, plus 488 districts
32,046
Wards and branches
451
Missions
385,490
Convert baptisms in 2025
Membership: from 280 to almost 18 million
Total membership at year end, 1830–2025. Sources: membership history table (Wikipedia, drawn from the Church Almanac and annual statistical reports); 2025 statistical report.
Membership grew slowly through the 1800s, as the Saints moved west and gathered converts from Britain and Scandinavia. Growth sped up after World War II. The Church passed 2 million in 1963, 5 million in 1982, 10 million in 1997 and 15 million in 2013. It added 377,431 members in 2025, its largest one-year gain since 1999, to reach 17,887,212.
The growth rate: fast, then steady
Year-over-year change in total membership, 1900–2025, calculated from the yearly membership totals.
Total membership keeps rising, but the percentage growth has slowed for decades. Annual growth often ran 4–6% through the 1980s, and 1989 hit 8.7%. It slid to about 2% in the 2000s and fell to 0.6% in 2020, when the pandemic paused missionary work and many baptisms. Since then it has recovered every year, from 1.47% in 2024 to 2.16% in 2025. Researchers at Mormonr point out that members, stakes and wards have all been growing at roughly 1.5% a year in recent decades. Most of that growth comes from convert baptisms rather than children born into the Church.
Temples dot the earth
Temples in operation, 1970–2025. 1970–2015 from the LDS membership statistics spreadsheet; 2016–2025 from Church statistical reports; 2022 from Church News (175 dedicated temples). Counting rules changed over the years: the 2023 figure includes four temples under renovation, and the 2025 report lists 204 in operation plus 7 in renovation.
In 1970 the Church had 13 temples. Expansion was gradual until 1998, when smaller temples that could be built faster and closer to members were announced. The count jumped from 68 at the end of 1999 to 102 a year later. Temple building has sped up again in the 2020s. The Church dedicated 16 temples in 2024 alone. At the end of 2025 it reported 204 temples in operation, 7 in renovation and 172 announced or under construction.
Stakes and congregations
Stakes (left axis; by decade 1900–1960, yearly from 1970) and wards and branches (right axis; yearly from 1970). Sources: LDS membership statistics spreadsheet through 2015; Church statistical reports 2016–2025.
A stake is a group of wards and branches, roughly like a diocese, and organizing one usually means the Church is well established in an area. There were 43 stakes in 1900, 537 in 1970 and 3,695 at the end of 2025. The 3,000th stake was organized in Freetown, Sierra Leone, in December 2012, and the 3,500th came about nine years later. Congregations rose from under 7,000 in 1970 to 32,046 today. Since about 2000, though, stakes and congregations have grown more slowly than total membership. Analysts see that gap as a sign of how hard it is to keep new members active.
Missionaries and missions
Full-time (teaching) missionaries, 1977–2025 (bars) and number of missions where reported (line: 1999 and 2013–2025). Sources: LDS membership statistics spreadsheet through 2015; Church statistical reports 2016–2024; 2025 from the Newsroom “Facts and Statistics” page (78,596, as of Dec. 31, 2025).
The missionary force has gone through two big swings. In 2012 the minimum age was lowered to 18 for young men and 19 for young women. The surge pushed the full-time force from about 59,000 to more than 83,000 in 2013 and 85,147 in 2014. COVID-19 then cut numbers to 51,819 in 2020. Since then the force has rebuilt steadily, to 74,127 in 2024 and 78,596 at the end of 2025. The Church formed 36 new missions in 2024, the most in any year since 2013, and now has 451.
Where new members come from
Convert baptisms and new children of record, 1970–2025. Sources: LDS membership statistics spreadsheet through 2015; Church statistical reports 2016–2025.
New members come in two ways: converts who are baptized, and children of members who are recorded when they are blessed. Converts have outnumbered children of record every year since 1976. Convert baptisms peaked around 1990 at about 330,000, fell to 125,930 in the pandemic year, and then rebounded sharply. 2024 was the strongest year since 1997, and 2025 reached 385,490, the highest total in this data set. Children of record tell a different story. They have drifted down from about 124,000 in 1982 to about 92,000 a year now, as Latter-day Saint birth rates have fallen.
Baptisms per missionary
Convert baptisms divided by full-time missionaries, 1977–2025. 1977–2015 from the LDS membership statistics spreadsheet; later years calculated from the statistical reports (2025 uses the year-end missionary count from the Newsroom facts page).
A rough measure of missionary success is how many converts are baptized for each full-time missionary. It peaked at about 8 per missionary in 1989. It dropped to about 3.4 after the 2013 age-change surge, when many more missionaries were serving but baptisms did not rise to match. The ratio has climbed since 2020, reaching 4.16 in 2024 and about 4.9 in 2025.
A worldwide church
Approximate share of Church membership by region, about 1989–1990, as summarized by sociologist Tim B. Heaton (BYU Religious Studies Center, 1998). Europe (4–5%) and the South Pacific (3–4%) are shown at the low end of the ranges he gave. Current regional figures will be added in the dynamic version.
In 1930 half of all Latter-day Saints lived in Utah, and 90% lived in the United States. Even in 1960, nine in ten members were American. That changed quickly. By 1989 South America held 16% of members and Mexico and Central America 11%, with Asia close behind. Between 1987 and 1989, more than 60% of new members came from Latin America. The Church now reports more members living outside the United States than inside it, and many of the stakes and districts organized in recent years are in Africa.
Activity and retention
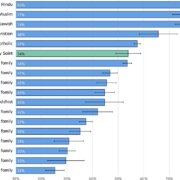
Self-reported church attendance among U.S. adults who identify as Latter-day Saints, 2025 Pew Research data as summarized by Mormonr. “Less often / other” is the remainder.
Records count everyone baptized or blessed. They do not show who attends. A 2025 Pew study found that 69% of self-identified U.S. Latter-day Saints attend church weekly, among the highest rates of any U.S. faith. Retention from childhood into adulthood is about 50% in the U.S., down from about 82% in the 1980s, which mirrors a broad decline in religious affiliation. Worldwide activity is harder to measure. An unofficial almanac estimate from 2011 put it near 30%. Outside estimates of how many new converts stay active range from 20% to 50%, depending on country and timeframe.
Charts are drawn as inline SVG straight from the data tables, so they need no scripts or plugins. Hover a bar or point to see its value. Definitions and counting methods in the Church’s reports have changed over time, so small year-to-year shifts can reflect reporting changes rather than real growth or decline.
https://gatheredin.one/wp-content/uploads/2026/11/lds-church-retention.jpg7561125Lancehttps://gatheredin.one/wp-content/uploads/2026/07/newest-logo-all-together-bell-arrows.pngLance2026-11-03 14:58:082026-11-03 21:29:39LDS Church Membership Statistics (Mormon Population)