
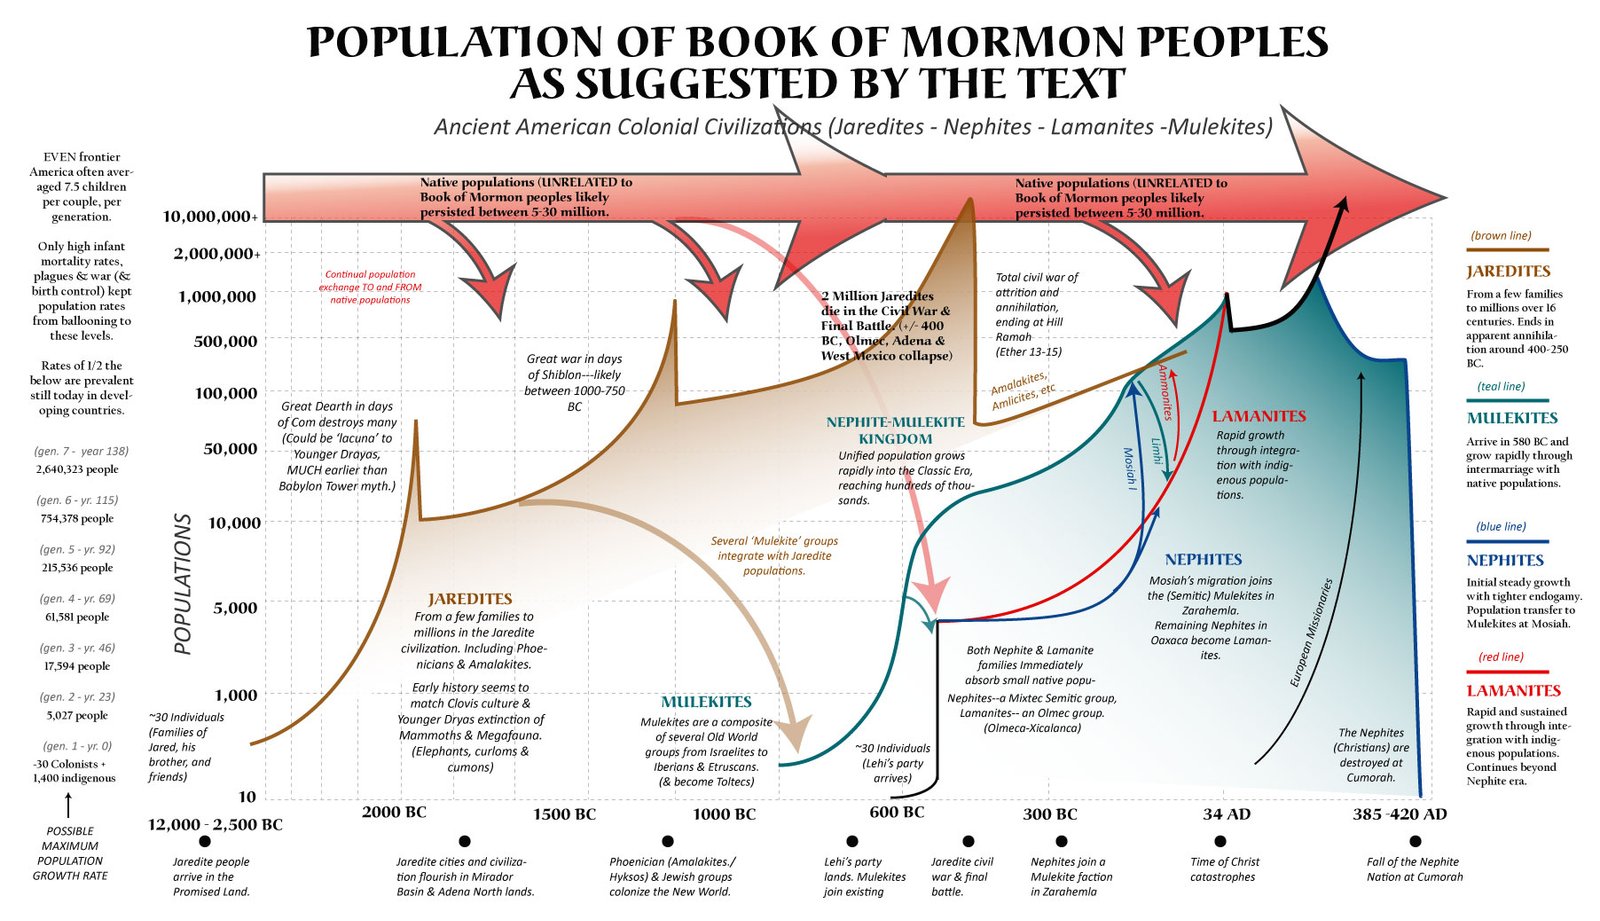
Populations in the Book of Mormon
History is full of examples of human populations jumping from a couple of thousand to well over a million in fewer than two hundred years, provided they have a high birth rate, ample agricultural land, and systems that keep infant mortality, war and pandemics at bay.
Introduction
Estimating the population dynamics within the Book of Mormon requires balancing explicit textual data with anthropological realities. The narrative describes a trajectory that expands from a single family group into massive, institutionalized empires capable of fielding armies in the hundreds of thousands. By analyzing the numeric references to troop strengths, casualties, and migrations within the text, we can construct a rigorous demographic timeline. Furthermore, evaluating these numbers against a specific Mesoamerican model—positioning the Land of Nephi in the Valley of Oaxaca, Zarahemla in the Mexican Highlands/Morelos, and the final retreat extending into North America—demonstrates how regional archaeology correlates with the immense population scales described in the text.
1. The Founding Era and the Reality of Integration (c. 600–500 BC)
The Book of Mormon narrative begins with an small, elite party departing Jerusalem: the family of Lehi, Ishmael, and Zoram. Nominally, this foundational group consists of roughly seven or eight couples, alongside unmentioned individuals implied by later marital unions (such as the sons of Ishmael marrying the daughters of Lehi).
Within a single generation of arriving in the Americas, however, the text describes a stark polarization into two distinct, competing geopolitical factions: the Nephites and the Lamanites. By the time of Lehi’s grandson, Enos, the Lamanites are already described as a highly numerous, aggressive population living in the wilderness. Mechanically, it is biologically impossible for a single family group of 5-8 couples to achieve this level of demographic density and genetic diversity within two generations through endogamy alone.
Textual and internal evidence strongly indicates that these founding parties immediately integrated with existing indigenous populations and remnants of prior civilizations (such as Jaredite or other native communities). During the reign of the second Nephite king, the prophet Jacob strongly condemns the sudden rise of unauthorized polygamy and concubinage among his people. For a strict, observant Israelite society bound by Mosaic tradition, systemic inbreeding would be unthinkable and culturally prohibited. The drive for multiple wives suggests a sudden influx of unattached, non-Israelite indigenous women entering the Nephite community. Likewise the mention of Sherem in Jacob 7, as an outsider visiting the community and Jaredite names strongly suggests interaction and association with outside populations. Concurrently, the “mark of darkness” placed upon the Lamanites is best understood anthropologically as a scriptural description of systemic intermarriage with the non-Semitic, native populations already occupying the continent, which rapidly accelerated their population growth relative to the more endogamous Nephite ruling class who seem to integrate with a existing smaller Semitic group.
[Add table of all evidence for indigenous integration here: Polygamy, Sherem, Mark of blackness, Mulekite language corrupted, Jaredite names among Nephites, Latin names like Lachoneus. Sermon’s on Jerusalem/New Jerusalem among late Jaredites. Mention of Amalakites (a biblical people).]
2. The First Great Shift: The Mosiah Migration to Zarahemla (c. 250–200 BC)
For several centuries, the Nephites remained in the Land of Nephi. In this analysis, the Land of Nephi is modeled as the Valley of Oaxaca, with its surrounding towns radiating out from the urban core of Monte Albán. Around 200–250 BC, King Mosiah I was warned by the Lord to flee the Land of Nephi with as many as would follow him into the wilderness.
This migration resulted in the discovery of the Mulekites in the Land of Zarahemla. The text explicitly notes that the Mulekites “were exceedingly numerous” and had already suffered severe internal conflicts, having arrived around the same time as Lehi (probably integrating with existing colonies themselves which caused their language to be ‘corrupted’, but without keeping written records. When the two groups unified under Mosiah’s kingship, the narrative establishes a distinct socio-political hierarchy: the incoming Nephites represented a highly literate, numerically small “ruling elite” or priestly class, while the underlying population base was composed of tens of thousands of Mulekites.
[ Land of Nephi: Valley of Oaxaca / Monte Albán ]
                      │
                      ▼ (Mosiah I Migration c. 250-200 BC)
[ Land of Zarahemla: Mexican Highlands / Valley of Morelos ]
  ├── Elite Ruling Class: Migrating Nephites (Small Number)
  └── Mass Base Population: Indigenous Mulekites (Tens of Thousands)
We can infer the massive scale of the underlying population from the breakaway Limhi expedition. A generation after Mosiah’s flight, a conservative Nephite group led by Zeniff returned south to reclaim their ancestral lands in Nephi. The subsequent records in the Book of Mosiah detail a series of brutal, localized wars against the Lamanites that reveal the density of the Oaxaca/Monte Albán region:
- In the first major battle, Zeniff’s forces kill 3,043 Lamanites in a single day, while losing 279 of their own men.
- In a subsequent war, Zeniff records that his forces “did slay them with a very great slaughter,” guarding their lands with an organized, permanent militia.
To suffer over 3,000 casualties in a single afternoon and continue launching offensive campaigns, the local Lamanite factions in the Valley of Oaxaca must have possessed an aggregate regional population well into the tens of thousands, matching the early-to-mid urban development stages of the Zapotec civilization.
3. The Classic Era of Mass Warfare: Captain Moroni and Helaman (c. 74–20 BC)
By the mid-1st century BC, the scale of conflict escalates from localized skirmishes to continental warfare. During the campaigns of Captain Moroni and the subsequent era recorded in Helaman chapters 1–10, the text details massive logistical movements, fortified city-networks, and unprecedented casualties.
Detailed War Breakdowns (Alma 50–65)
- The War of Amalickiah’s Intrigue (Alma 51–52): Amalickiah incites a massive Lamanite army to attack the eastern borders of the Nephites. In the defense of the city of Nephihah and the borders by the sea, thousands of Lamanites are slain. Moroni’s highly disciplined, armored troops consistently achieve asymmetric casualty ratios, but the sheer volume of incoming Lamanite troops requires total mobilization.
- The Western Campaign and the Stripling Warriors (Alma 56–58): In the southwestern theater, Helaman takes command of the 2,000 ammonite youths. In these battles to recapture cities like Antiparah, Cumeni, and Manti, casualties are severe. Helaman notes that in one fierce engagement, the Nephites were forced to slaughter thousands of prisoners who revolted on a forced march between Manti and Zarahemla, demonstrating that the sheer volume of captives was unmanageable for a standard military escort.
- The Battle of Zerahemnah (Alma 43–44): Fought on the banks of the River Sidon, this battle concludes with Moroni trapping the Lamanites. The text notes that the number of dead “was not numbered because of the greatness of the number,” and the bodies were cast into the river to be washed out and “buried in the depths of the sea.”
The Gadianton Crisis and the Great Gathering
The demographic peak of the late Preclassic text occurs during the Gadianton Robber wars. To withstand a total economic and military siege by the Gadianton Robbers, the governor Lachoneus commands the entire population to consolidate into a single, massive, fortified agricultural and urban zone. The text records the result of the final clash:
“And it came to pass that they did go forth against them, and did slay them by thousands and by tens of thousands, until they had slain them all; and Giddianhi was slain, and Zemnarihah was hanged.” (Inferred from Helaman/3 Nephi 4)
For an empire to regularly field armies that can withstand, surround, and kill enemies by the “tens of thousands,” the underlying population must be exceptionally large. A society cannot lose or deploy 50,000 troops at a time without an agrarian and urban base numbering in the hundreds of thousands, if not millions.
In this model, the fortified central city built by Lachoneus corresponds directly to the great metropolis of Teotihuacan in the Mexican Highlands. The archaeological consensus places the population of the Basin of Mexico and the adjacent Valley of Morelos (the Land of Zarahemla) at hundreds of thousands of people during this era, representing a massive urban and agricultural powerhouse. This high-density highland population stood in stark geopolitical contrast to the Epi-Olmec and Zapotec empires of the southern lowlands and valleys (the Lamanites), matching the sweeping scale of the wars described throughout the Book of Alma.
4. The Final Collapse: Millions in the Entire Land (c. 385–421 AD)
The tragic climax of the Book of Mormon describes a total scorched-earth war of extermination. Mormon records the final mobilization of the Nephite nation as they retreat step-by-step from their southern homelands.
At the final battle of Cumorah, Mormon provides an explicit, chilling tally of the destruction. He lists twenty-three Nephite commanders, each leading a division of 10,000 troops, all of whom were completely annihilated except for a tiny remnant of twenty-four individuals:
“And it came to pass that they did fall upon my people with the sword… even two hundred and thirty thousand of my people had fallen.” (Inferred from Mormon 6)
[ Total Mobilization for Final Battle ] ──► 230,000 Nephite Casualties
                                                    │
                                                    ▼
                                       Requires a Base Population
                                       Well into the Millions
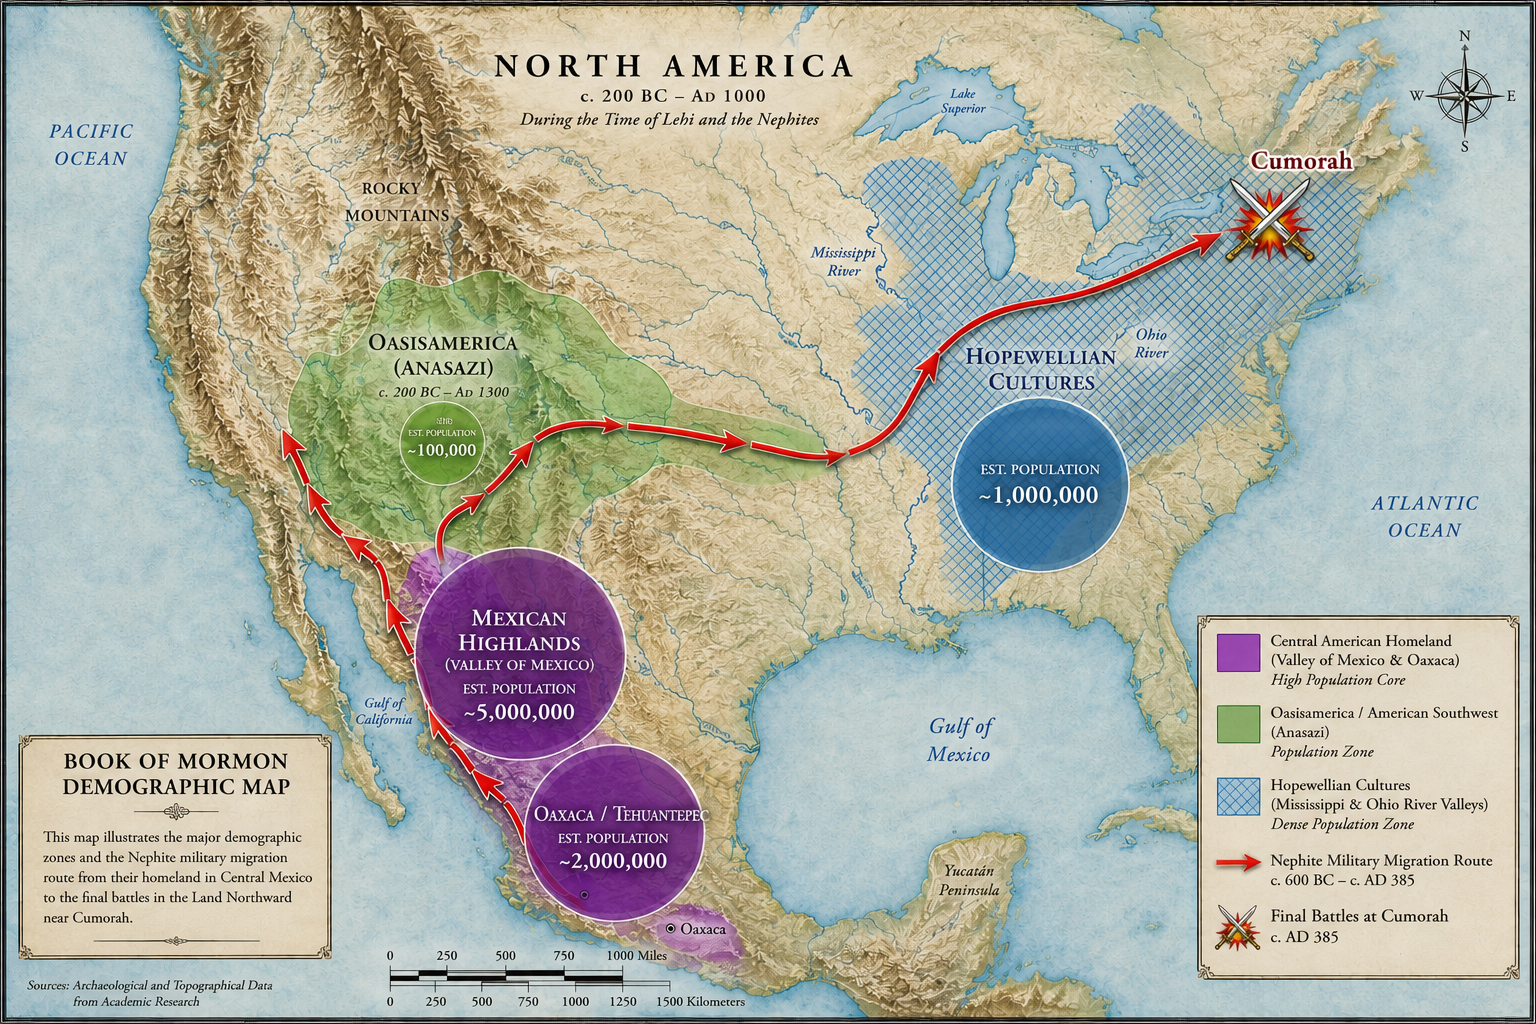
For the Lamanites to field an organized, fully armed military force of ~70-100,000 or more to defeat the armed 230,000 men, women and children of the Nephites, the society must have been drawing from an aggregate population well into the millions. In our model, this demographic distribution is explained by an expansive migration path: only the elite ruling class and a core army of roughly 50,000 were chased out of the Valley of Mexico (Zarahemla). They retreated up through West Mexico into the Oasisamerica/Anasazi lands, and ultimately migrated eastward into the densely populated Hopewell river valleys of North America. The vast majority of the 230,000 casualties slaughtered at the final battle were likely local Hopewellian populations who had been swept up and gathered into the New York region.
This scale of total systemic destruction echoes the earlier Jaredite collapse recorded in the Book of Ether. The text explicitly notes that the final Jaredite civil wars resulted in the deaths of two million people over the course of its multi-year span. Because the text explicitly frames the later Nephite/Lamanite civilization as being even larger and more widely spread across the face of the land than their Jaredite predecessors, the text demands a continental population model that numbers deep into the millions.
5. Scriptural Population and Casualty Ledger
The following chart indexes every major explicit numerical reference to population sizes, army strengths, and casualties within the Book of Mormon text, accompanied by contextual analytical notes.
| Scripture Reference | Number / Tally Mentioned | Contextual Demographic Notes & Interpretations |
| Ether 6:16 | ~”about 24 souls” | Initial Jaredite group that leaves ‘the tower’ and crosses ocean in covered boats. |
| Ether 15:2 | ~2 Million+ slain | 2 Million+ casualties over the course of a brutal 4 year civil war spanning all of Jaredite lands (BEFORE the final battle). |
| 1 Nephi 2:2–5 | ~8 individuals | The initial Lehi family party departing Jerusalem (Lehi, Sariah, Laman, Lemuel, Sam, Nephi). |
| 1 Nephi 7:6–22 | ~14–30 individuals | The addition of the family of Ishmael and Zoram, creating approximately 6 marital couples and many children. (at least 2 ea?) |
| 2 Nephi 5:5–6 | “All those who would go with me” | The first formal political split. Nephi flees into the wilderness with his immediate family, Sam, Zoram, Jacob, Joseph, and their sisters, implying a baseline Nephite group of under 6 couples (likely about 14-30 people) |
| Jacob 1:12–17 (ch.2-7) | “The people” (multiple instances) | Sherem & Polygamy sermon suggests they began to integrate with an existing group of natives. Jacob’s speech to the 2nd generation suggests a few hundred. |
| Jarom 1:8 | “Multiplied exceedingly & spread” | Within 200 years of arrival, the Nephites are noted as covering the face of the land, requiring significant indigenous integration to achieve rapid growth. |
| Omni 1:17 | “Exceedingly numerous” | The textual description of the Mulekite population at Zarahemla upon their discovery by Mosiah I. Inferred to be tens of thousands. |
| Mosiah 9:18 | 3,043 Lamanites / 279 Nephites | Explicit casualties killed in a single afternoon during Zeniff’s first defensive war in the Land of Nephi (Oaxaca). |
| Mosiah 11:19 | “Boasted in their own strength” | King Noah’s small guard successfully beats back a Lamanite scouting party, suggesting localized skirmishes numbering in the hundreds. |
| Mosiah 25:2–3 | “Not half so numerous” | Mulekites more numerous than Nephites but less than half the Lamanite population. |
| Alma 2:19 | 12,532 Amlicites / 6,562 Nephites | Casualties from the first day of the Amlicite civil war near Zarahemla. Total single-day deaths exceed 19,000, implying active armies of at least 40,000–70,000. |
| Alma 2:27 | “numerous almost… as the sands of the sea” | Confirming the numbers of Alma 2:19, if a single first battle has ~20k deaths, armies are likely in the 40,000–70,000 range. |
| Alma 3:3 | “Innumerably slain” | Combined Amlicite/Lamanite dead cast into the River Sidon. Contextually implies an uncounted mass of casualties numbering over 10,000. |
| Alma 28:2–3 | “A tremendous battle” | Tens of thousands of Lamanites are slain in a massive invasion trying to avenge the Anti-Nephi-Lehies. Described as the greatest slaughter since Lehi left Jerusalem. |
| Alma 43:5,14 | “Innumerable hosts” | Zerahemnah’s invading Lamanite army. In the context of ancient military hyperbole, this indicates a force that completely overwhelmed standard local scouting estimates (likely 40,000+). |
| Alma 56:46–54 | 2,000 (later 2,060) youths | The exact troop count of Helaman’s sons (the Stripling Warriors) operating in the southwestern theater. |
| Alma 57:33 | “The greater part… were slain” | The forced execution of Lamanite prisoners during a military revolt on the march from Manti to Zarahemla, implying the sudden death of thousands of captives. |
| Helaman 4:25 | “They had become weak” | The Nephites lose half of their total lands to a massive Lamanite push, implying defensive armies numbering over 50,000 being overrun. |
| 3 Nephi 4:21–27 | “Thousands, and tens of thousands“ | Total casualties of the Gadianton Robbers during their failed siege of Lachoneus’s centralized stronghold (Teotihuacan). Represents forces reaching 100,000 combatants. |
| Mormon 1:6–7 | “Numerous almost, as it were the sand of the sea” | Mormon suggests the Land of Zarahemla has a staggering population, (likely beyond his belief) compared to his homeland in Desolation. |
| Mormon 2:2–3 | “An exceedingly great power” [size of force] | Given the numbers later in the chapter, and the fact that this drives them from power, the Lamanite force was likely 50-80,000 strong. |
| Mormon 2:9 | 44,000 Lamanites / 42,000 Nephites | The explicit troop strength of the opposing armies in Mormon’s early campaigns in the Land of Joshua by the West Sea. |
| Mormon 2:25 | 30,000 Nephites / 50,000 Lamanites | The exact size of the main Nephite army led by Mormon as they successfully defended their northern borders against a fresh Lamanite advance. |
| Mormon 6:10–15 | 230,000 Nephites slain | The final casualty count of the Nephite nation at the Battle of Cumorah. 23 distinct commanders each lose an entire division of ~10,000. |
Conclusion: Textual Data Versus Archaeological Reality
To preserve the analytical integrity of this study, we must strictly separate what the text explicitly states from what modern archaeological models suggest.
The textual data stands completely on its own: it demands an environment characterized by immense urban gatherings, extensive defensive fortifications, massive agricultural networks capable of feeding hundreds of thousands during prolonged sieges, and highly organized military structures capable of suffering tens of thousands of casualties without immediate societal collapse.
When we evaluate the broader archaeological record of the pre-Columbian Americas during the Preclassic and Classic periods (c. 600 BC – 400 AD), the Mesoamerican Highland model is the only geographical region that possesses the demonstrated demographic capacity to match these numbers.
The massive urban footprint of Teotihuacan, the dense agricultural output of the Valley of Morelos, and the extensive, multi-valley defensive systems of the Zapotec empire in Oaxaca provide the exact scale of human density required to sustain the massive populations described within the Book of Mormon text. Far from being a series of isolated family skirmishes, the text describes a clash of highly populated, complex states—a reality that aligns perfectly with the ancient urban centers of highland Mexico.
.
Comparing the historical demography of pre-Columbian North America (north of the Rio Grande) to Mesoamerica reveals one of the most stark geographic imbalances in the ancient world. While both regions featured highly advanced societies, the shear scale, density, and urbanization of Mesoamerica VASTLY outpaced its northern neighbor.
Likely almost entirely because of the North American native’s lack of metal tools—and thus inability to effectively clear timberland for farmland.
1. Macro-Population Estimates (The Scale Gap)
For decades, historical demographers have debated the exact numbers, but a general scholarly consensus has solidified around regional ratios.
- Mesoamerica (High Density): Modern estimates for the population of Mesoamerica on the eve of contact generally range from 15 to 25 million people (with some high-counters pushing past 30 million). Central Mexico alone—the core of the Aztec Empire—sustained upwards of 5 to 6 million people.
- North America (Low to Moderate Density): For the vast landscapes of the United States and Canada, the consensus estimate is far lower, sitting between 3.5 and 7 million people. With the eastern United States harboring about half to two-thirds of that total population. (2 to 4 million people)
Even in modern times, when we exclude urban centers larger than 1000 people, the population density of most eastern U.S. states is about 15-30 people per square mile. Excluding these urban centers, the modern population of the eastern U.S. is less than 20 million. It was this lack of urban centers, and the general inability to develop them which kept the ancient North American population so low. Only short and localized cultures broke free of these demographic realities, creating short lived population booms of urbanization which left their mark on the landscape through mound building–particularly during the Adena, Hopewell, and Mississippian mound builder episodes.
2. Urbanization and Trajectories Over Time (1000 BC to 1500 AD)
The demographic curves of the two regions followed entirely different trajectories dictated by agricultural intensity, geography, and political institutionalization.
Mesoamerica: The Linear Expansion of High Urbanism
Mesoamerica’s growth was driven by hyper-efficient agriculture, notably maize domestication and chinampa (floating garden) wetland systems. This allowed for continuous, massive urban growth over 2,500 years.
- Preclassic (1000 BC – 250 AD): The Mirador Basin in the Maya lowlands saw massive cities like El Mirador, which boasted tens of thousands of residents and monumental architecture comparable to the Egyptian pyramids.
- Classic (250 AD – 900 AD): Teotihuacán peaked at an estimated 100,000 to 150,000 residents, making it one of the largest cities in the world at the time. Cholula and Tikal grew to similar epic proportions.
- Postclassic (900 AD – 1521 AD): Despite localized “collapses” (such as the southern Maya abandonment), the overall population of Mesoamerica continued to swell. By 1519, the Aztec capital of Tenochtitlan housed an estimated 200,000+ people, sustained by a highly organized, tribute-paying imperial network.
North America: The Cyclic Boom-and-Bust of Chiefdoms
North American population growth was non-linear, characterized by localized spikes followed by dramatic, climate-driven contractions.
- The Woodland and Mississippian Peaks: Populations grew steadily for 2,000 years, culminating in a continental population peak around 1150 AD. This era saw the rise of Cahokia (near modern St. Louis), the urban peak of North America, holding an estimated 10,000 to 20,000 people.
- The Pre-Contact Crash: Recent spatiotemporal radiocarbon studies confirm that between 1150 AD and 1450 AD—long before Europeans arrived—North America suffered a roughly 30% population decline. Mega-droughts, localized warfare, resource depletion, and endogenous diseases caused Mississippian centers like Cahokia and southwestern ancestral Pueblo hubs (like Mesa Verde and the Hohokam region) to be completely abandoned. By 1500 AD, North American populations had largely decentralized into the dispersed chiefdoms and tribal confederacies encountered by early explorers.
3. How the Americas Compared to Europe and the Middle East
When looking globally, pre-Columbian Mesoamerica was not an isolated anomaly—it was fully comparable to the densest centers of Afro-Eurasia.
       [ ESTIMATED REGIONAL POPULATIONS IN 1492 AD ]

Mesoamerica:        █████████████████████ (15 - 25 Million)
Continental Europe: ███████████████████████████████████████████████████ (60 - 65 Million)
Middle East:        █████████████ (10 - 15 Million)
North America:      ██████ (3.5 - 7 Million inc. California, Canada etc.)
Mesoamerica vs. Europe/Middle East
- Density: In 1492, some author’s speculate that the total population of the Americas was roughly equivalent to the total population of Europe (~60 million). However, just a quick comparison in architecture quickly dispels such a myth. More realistic researchers suggest Europe likely doubled the population of the America’s by the time of the conquest. With plague chopping that North American population in half yet again. However, Mesoamerica specifically was more densely populated than the Middle East or Western Europe at various points in history.
- City Scale: When the Spanish entered Tenochtitlan, it was likely larger than Paris, London, or Madrid. Only a few Old World megacities, such as Constantinople, Cairo, or Hangzhou, surpassed the scale of the Aztec capital.
- Political Structure: The highly bureaucratized triple-alliance (Aztec) and the prior Maya city-state networks matched the organizational complexity, tax/tribute collection efficiency, and standing military capabilities of the Roman Empire or the Ottoman Caliphate.
- Architecture: At the time of the conquest, the Mexican Highland would have FAR MORE resembled the impressive Mayan city centers of south Mexico & Guatemala, but the VAST majority of civic buildings (pyramids & temple complexes) were disassembled to build the hundreds of colonial Catholic Cathedrals.
North America vs. Europe/Middle East
- North America, by contrast, lacked the population for sustained urban hubs seen in Mesoamerica, Europe or the Levant.
- While the Mississippian chiefdoms featured complex social stratifications and impressive earthworks, their populations were closer in density and socio-political structure to the Bronze Age or early Iron Age tribal chiefdoms of Atlantic Europe (such as the Pre-Roman Celts or Germanic tribes) rather than the highly urbanized empires of the Mediterranean.
Summary of Demographics
Serious researchers emphasize that the Pre-Columbian Americas were completely settled, but the environment dictated the lifestyle. Mesoamerica was an urban, imperial powerhouse, in some cases nearly matching the scales of Roman & European history. North America on the other hand was a dynamic, ecologically balanced rural landscape where populations successfully managed vast resources, but structural urbanism was largely absent because of industrial water management, lack of large-scale sustained deforestation techniques and cyclic climatic shifts.
.
To understand how a tiny group reaches a million so quickly, you have to look at the rule of compounding interest applied to biology. If a closed population maintains a 3.5% net annual growth rate (which occurs when a birth rate of 4.5% minus a death rate of 1.0% creates a doubling effect every 20 years):
- Year 0: 2,500 people
- Year 20: 5,000 people
- Year 60: 20,000 people
- Year 120: 160,000 people
- Year 180: 1,280,000 people
.
In the field of historical demography, there are three classic examples of extreme isolated growth. While two of them started slightly larger than your baseline or stopped just shy of a million, they represent the absolute limit of what human reproduction can achieve in total isolation when resources are practically infinite.
1. The French Canadians (The St. Lawrence Valley)
This is universally considered the gold standard of natural human population growth in written history.
- The Starting Seed: Between 1608 and 1760, only about 8,500 total French immigrants permanently settled along the St. Lawrence River in Quebec. When the British took control of Canada in 1763, French immigration completely stopped. The population at that exact moment of absolute isolation was roughly 65,000 people.
- The High-Growth Windows: Because land was vast and food was abundant, French Canadians married incredibly young and experienced a massive “demographic boom.” For over two centuries, their Total Fertility Rate (TFR) averaged an astonishing 7.5 to 8.0 children per woman. The birth rate was frequently over 45 to 50 births per 1,000 people annually.
- The Result: Without a single drop of new French immigration after 1760, this small founding population of 65,000 reached 1 million people by roughly 1850 (~90 years). By the mid-20th century, the descendants of those original 8,500 settlers exploded to over 6 million people in Canada and New England, purely through natural internal growth.
2. The Boers / Afrikaners (South Africa)
The Dutch, French Huguenot, and German settlers who formed the frontier “Boer” population in South Africa provide another stunning example of isolated compounding growth.
- The Starting Seed: By the early 1700s, the “Free Burgher” (settler) population at the Cape of Good Hope was a tiny colony of roughly 1,500 to 2,000 people. Organized European immigration to the Cape mostly dried up shortly thereafter.
- The High-Growth Windows: As the Boers migrated into the interior (becoming Trekboers), they relied on massive families to run expansive livestock farms. From 1700 through 1850, the average completed fertility rate stayed incredibly stable at 7.5 to 8.5 children per married woman. Their birth rate sat near 50 per 1,000 while their isolated, outdoor lifestyle kept mortality rates lower than crowded European cities.
- The Result: From that initial seed of under 2,000 people in the early 1700s, the white Afrikaner population ballooned to over 500,000 by 1904 and crossed the 1 million mark by the 1930s—almost exclusively driven by internal generational compounding.
3. The Enslaved Population of the United States
While this is a deeply tragic chapter of history rather than a voluntary colony, it represents an unparalleled demographic phenomenon: it is the only enslaved population in the Americas that experienced massive internal growth rather than relying on the slave trade to maintain its numbers.
- The Starting Seed: In 1700, the enslaved population in the American colonies was roughly 28,000 people. In 1808, the United States federally banned the transatlantic slave trade completely, entirely cutting off the legal influx of new people from Africa. At that moment of closure, the population was roughly 1 million.
- The High-Growth Windows: Unlike the Caribbean or South America—where harsh sugar plantation labor caused deaths to vastly outnumber births—the American South featured different crop demands (like tobacco and cotton) and a climate less prone to tropical diseases. Enslaved women had incredibly high birth rates, averaging 7 to 8 children per woman, yielding an internal natural growth rate of roughly 2.5% to 3.0% per year.
- The Result: After the 1808 ban on external migration, the population grew entirely from internal births. It rocketed from 1 million in 1808 to nearly 4 million by the onset of the Civil War in 1860
